Introduction
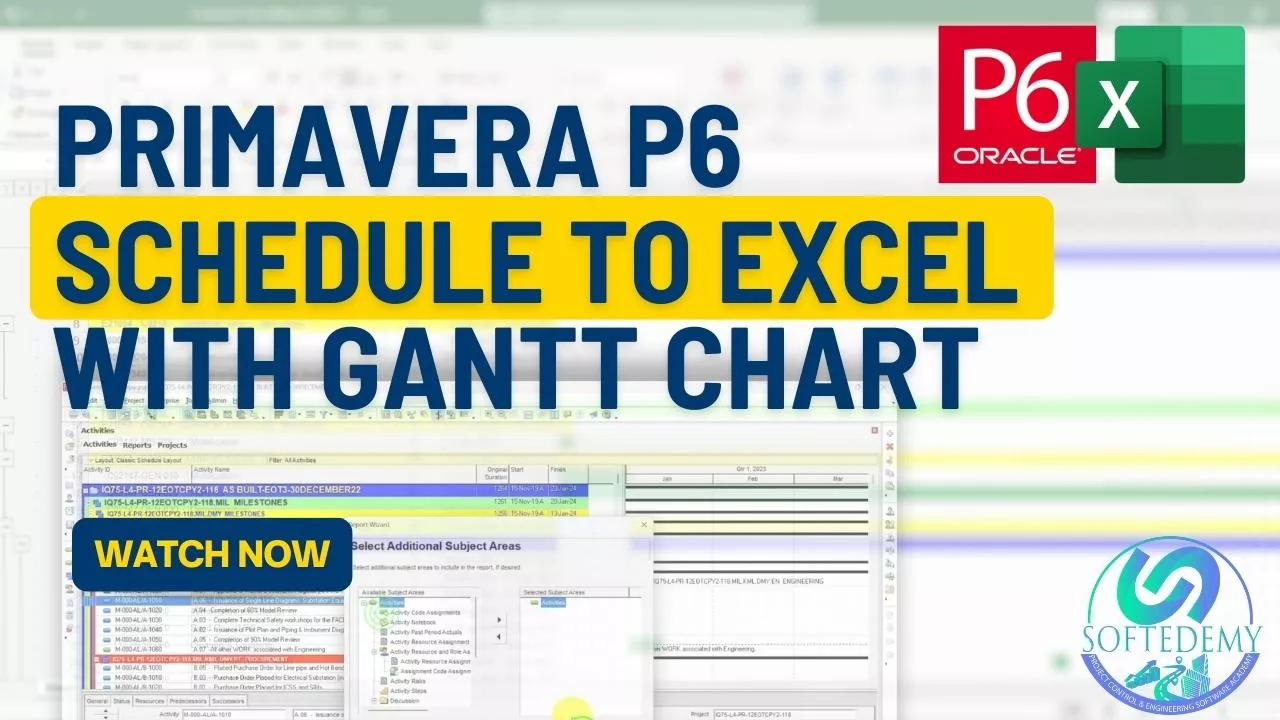
Managing complex projects can be a daunting task. With multiple activities and teams involved, it can become challenging to keep track of progress and stay on schedule. This is where project management tools like Primavera P6 come into play. However, sometimes it becomes necessary to export project data to Excel for various reasons, such as sharing data with stakeholders who are not familiar with Primavera P6. In this blog, we will explore a quick and easy method to convert a Primavera P6 schedule to Excel.
Managing complex projects often requires specialized project management software to help create and manage project schedules. One such tool is Primavera P6, which is widely used in the construction and engineering industries. While Primavera P6 is a powerful tool for creating project schedules, sometimes it’s necessary to export the schedule data into another format, such as Excel. In this blog post, we’ll explore how to convert a Primavera P6 schedule to Excel using a quick and easy method.
Exporting the Primavera P6 Schedule to Excel
The first step in converting a Primavera P6 schedule to Excel is to export the schedule data. Primavera P6 allows you to export data in several different file formats, including XLSX. To export the schedule data as an XLSX file, follow these steps:
In Primavera P6, go to the Projects view and select the project you want to export.
Click on the Activities tab to view the list of activities for the project.
Click on the Export button in the toolbar and select XLSX as the export format.
Choose the columns you want to include in the export, such as Activity ID, Activity Name, Start Date, and Finish Date.
Click Export and save the XLSX file to your computer.
Alternatively, you can also copy the schedule data directly from Primavera P6 and paste it into Excel. To do this, select the activities you want to copy in Primavera P6, right-click and choose Copy, then switch to Excel and paste the data into a new worksheet.
Converting Data to a Gantt Chart in Excel
Once you have the data in Excel, the next step is to create a Gantt chart. This can be done manually, but it can be time-consuming and prone to errors. Instead, you can use a macro-based tool that can convert the data into a Gantt chart automatically.
Download XER to XLSX Gantt Chart Converter Tool
Download From below Link
One such tool is the XER to XLSX Gantt Chart Converter Tool. This tool is designed specifically to convert data from Primavera P6 to Excel and create a Gantt chart automatically. Here’s how to use it:
Open the XER to XLSX Gantt Chart Converter Tool in Excel.
Paste the Primavera P6 data in the required sequence of columns, including the activity ID, activity name, start and finish dates, and any other columns you exported.
Click on the “Create Gantt Chart” button.
The tool will take a few seconds to process the data and create the Gantt chart.
A new worksheet will be created with the Gantt chart, and all the days will be colored using conditional formatting in Excel.
Using the Excel Gantt Chart
The Excel Gantt chart created using the XER to XLSX Gantt Chart Converter Tool can be used for various purposes. It is a useful tool for sharing project progress with stakeholders who may not be familiar with Primavera P6. The chart can be easily customized to suit your specific requirements, such as adjusting the time scale, adding or removing activities, or changing the formatting.
Benefits of Converting Primavera P6 Schedule to Excel
Converting a Primavera P6 schedule to Excel can be beneficial for several reasons. Here are a few examples:
Clients may prefer to view project schedules in Excel rather than Primavera P6, especially if they are not familiar with the software.
Excel allows for more flexibility in terms of formatting and customization, making it easier to create custom reports and dashboards.
Converting the schedule to Excel can make it easier to collaborate with team members who do not have access to Primavera P6.
Excel is a widely-used software that most people are familiar with, so there is no need for additional training or software installations.
Tutorial for Primavera P6 Schedule to Excel: Creating Gantt Charts with XER to XLSX Tool in Excel
Conclusion
Converting a Primavera P6 schedule to Excel can be a simple and straightforward process. By using the XER to XLSX Gantt Chart Converter Tool, you can quickly convert data from Primavera P6 to Excel and create a Gantt chart automatically. The resulting Excel Gantt chart can be customized and used for various purposes, such as sharing project progress with stakeholders.
Frequently Asked Questions:
What is Primavera P6 and how is it used in project management?
Primavera P6 is a project management tool widely used in construction and engineering industries to create and manage project schedules. It helps in tracking progress and staying on schedule.
Why is it sometimes necessary to export Primavera P6 data to Excel?
It becomes necessary to export Primavera P6 data to Excel for sharing data with stakeholders who are not familiar with Primavera P6.
How can you export Primavera P6 data to Excel?
To export Primavera P6 data to Excel, go to the Projects view, select the project, click on the Activities tab, click on the Export button, select XLSX as the export format, choose the columns to be included in the export, and save the XLSX file to the computer. Alternatively, select the activities to be copied, right-click and choose Copy, switch to Excel and paste the data into a new worksheet.
What are the benefits of converting Primavera P6 schedule to Excel?
The benefits of converting Primavera P6 schedule to Excel include: clients may prefer to view project schedules in Excel, Excel allows for more flexibility in terms of formatting and customization, it makes collaboration easier with team members who do not have access to Primavera P6, and it is widely used software that most people are familiar with.
How can you convert Primavera P6 data to a Gantt chart in Excel?
To convert Primavera P6 data to a Gantt chart in Excel, use a macro-based tool like the XER to XLSX Gantt Chart Converter Tool, which can automatically create a Gantt chart from the data. Paste the Primavera P6 data in the required sequence of columns, including the activity ID, activity name, start and finish dates, and any other columns exported, and click on the “Create Gantt Chart” button. The tool will process the data and create the Gantt chart, which can be customized and used for various purposes.
What is the XER to XLSX Gantt Chart Converter Tool, and how does it work?
The XER to XLSX Gantt Chart Converter Tool is a macro-based tool designed to convert data from Primavera P6 to Excel and create a Gantt chart automatically. To use the tool, open it in Excel and paste the Primavera P6 data in the required sequence of columns, including activity ID, activity name, start and finish dates, and any other columns exported. Then, click on the “Create Gantt Chart” button, and the tool will process the data and create the Gantt chart in a new worksheet with conditional formatting in Excel.
Can you create a Gantt chart manually in Excel, or do you need a tool?
It is possible to create a Gantt chart manually in Excel, but it can be time-consuming and prone to errors. Instead, it is recommended to use a tool such as the XER to XLSX Gantt Chart Converter Tool to convert data from Primavera P6 to Excel and create a Gantt chart automatically.
What are some examples of how the Excel Gantt chart can be used?
The Excel Gantt chart can be used for various purposes, such as sharing project progress with stakeholders who may not be familiar with Primavera P6. The chart can be easily customized to suit specific requirements, such as adjusting the time scale, adding or removing activities, or changing the formatting. The chart is also a useful tool for creating custom reports and dashboards.
What are the advantages of using Excel over Primavera P6 for project management?
There are several advantages of using Excel over Primavera P6 for project management. Excel is more flexible in terms of formatting and customization, making it easier to create custom reports and dashboards. Converting the Primavera P6 schedule to Excel can also make it easier to collaborate with team members who do not have access to Primavera P6. Additionally, Excel is a widely-used software that most people are familiar with, so there is no need for additional training or software installations.
How can you customize the Excel Gantt chart to suit your needs?
The Excel Gantt chart can be customized in various ways to suit specific requirements. For example, the time scale can be adjusted, and activities can be added or removed as needed. Additionally, the chart’s formatting can be changed to include different colors, fonts, and styles. Finally, the chart can be modified to include additional information, such as resource allocation or project milestones.
Is it possible to import an Excel Gantt chart into Primavera P6?
Yes, it is possible to import an Excel Gantt chart into Primavera P6. Primavera P6 allows you to import data from various sources, including Excel. To import the Excel Gantt chart into Primavera P6, you will first need to export the chart data from Excel in a compatible format, such as CSV or XLSX. Once you have the file, you can import it into Primavera P6 using the Import Wizard. However, note that some formatting and functionality may be lost during the import process, so it’s essential to check the imported data and make any necessary adjustments.
What are some common problems you may encounter when converting Primavera P6 data to Excel?
When converting Primavera P6 data to Excel, you may encounter several common issues. Some of these include formatting problems, data compatibility issues, and missing or incorrect data. Formatting problems can arise due to differences in the way Primavera P6 and Excel handle data formatting, which can cause issues such as incorrect date and time formats. Data compatibility issues can occur if the exported data format is not compatible with Excel or if the data contains unsupported characters or symbols. Missing or incorrect data can be caused by incorrect export settings, incomplete data, or data corruption.
How can you troubleshoot issues when converting Primavera P6 data to Excel?
To troubleshoot issues when converting Primavera P6 data to Excel, you can try several solutions. First, ensure that the exported data format is compatible with Excel, and that there are no unsupported characters or symbols in the data. Check that the export settings are correct, and that all necessary data is included in the export. If there are formatting issues, try adjusting the formatting settings in Excel or Primavera P6 to ensure that the data is displayed correctly. You can also try exporting the data in a different format or using a different export method. Finally, if all else fails, you may need to seek help from Primavera P6 support or Excel support.
Can you export Primavera P6 data to other file formats besides XLSX?
Yes, Primavera P6 allows you to export data to several other file formats besides XLSX. Some of these formats include CSV, XML, and MPX. CSV is a simple, comma-separated file format that can be easily imported into Excel or other software. XML is a more complex file format that allows for more detailed information to be exported. MPX is a format that can be used to transfer data between different project management software applications.
How do you know which columns to include when exporting Primavera P6 data to Excel?
When exporting Primavera P6 data to Excel, how do you know which columns to include?
To export Primavera P6 data to Excel, you need to choose the columns that you want to include in the export. The columns you choose will determine the information that is included in the Excel file. When selecting columns, consider the purpose of the export and the information that is important to your stakeholders. For example, if you want to share the project schedule with stakeholders, you may want to include columns such as Activity ID, Activity Name, Start Date, and Finish Date. To select columns, go to the Activities tab in Primavera P6 and click on the Export button in the toolbar. Then choose the XLSX format and select the columns you want to include in the export. Alternatively, you can copy the data directly from Primavera P6 and paste it into Excel.
Can you export the entire Primavera P6 schedule to Excel, or just certain activities?
Yes, it is possible to export the entire Primavera P6 schedule or just certain activities to Excel. Primavera P6 allows you to export data in several different file formats, including XLSX. To export the schedule data as an XLSX file, go to the Projects view in Primavera P6 and select the project you want to export. Click on the Activities tab to view the list of activities for the project. Click on the Export button in the toolbar and select XLSX as the export format. Choose the columns you want to include in the export, such as Activity ID, Activity Name, Start Date, and Finish Date, and click Export. Alternatively, you can also copy the schedule data directly from Primavera P6 and paste it into Excel. To do this, select the activities you want to copy in Primavera P6, right-click and choose Copy, then switch to Excel and paste the data into a new worksheet.
How can you share the Excel Gantt chart with stakeholders who do not have access to Primavera P6?
Sharing Excel Gantt chart with stakeholders who do not have access to Primavera P6 is simple. Once the Gantt chart is created in Excel using the Primavera P6 schedule data, it can be saved as an Excel file and shared via email or file-sharing services. Another option is to convert the Excel file to a PDF format and then share it. This way, the stakeholders can view the Gantt chart without needing access to Primavera P6. It’s important to ensure that the Excel file is formatted and organized in a clear and understandable way for stakeholders to easily understand the project schedule. Adding a legend or key to the chart can also be helpful.
How can you ensure that the Excel Gantt chart stays up-to-date with the Primavera P6 schedule?
To ensure that the Excel Gantt chart stays up-to-date with the Primavera P6 schedule, you can regularly update the Excel file with the latest data from Primavera P6. After exporting the schedule data from Primavera P6 to Excel, you can use macros or formulas to update the Gantt chart automatically based on any changes in the schedule. Another option is to use add-ins or plugins that can sync data between Primavera P6 and Excel, which will automatically update the Gantt chart as well.
What are some best practices for creating a Gantt chart in Excel?
When creating a Gantt chart in Excel, there are several best practices to keep in mind. First, organize the project data in a logical and consistent manner, such as by grouping tasks by project phase or by using a color-coding system to differentiate between different types of tasks. Next, use conditional formatting to highlight critical path tasks and to make the Gantt chart easier to read. Additionally, include key project milestones, and use labels to provide more information about each task. Finally, regularly update the Gantt chart to ensure it accurately reflects the project’s progress.
How can you speed up the process of converting Primavera P6 data to Excel?
To speed up the process of converting Primavera P6 data to Excel, you can use a third-party tool such as the XER to XLSX Gantt Chart Converter Tool. This tool is designed specifically to convert data from Primavera P6 to Excel and create a Gantt chart automatically. By using this tool, you can avoid manually copying and pasting data and reduce the risk of errors. Additionally, using macros or formulas can help automate the updating process and save time in the long run. Finally, ensure that the data is organized in a consistent and logical manner to make the Gantt chart easier to read and update.
Can you use the Excel Gantt chart for resource planning and allocation?
Yes, Excel Gantt chart can be used for resource planning and allocation. The Gantt chart displays a visual representation of the project schedule and helps identify project tasks, their timelines, and interdependencies. Using the chart, you can allocate resources by assigning team members to specific tasks and track their progress in real-time. You can also use Excel formulas to calculate the total amount of time required for each task and the resources needed to complete the project. By doing so, you can ensure that resources are used efficiently and avoid overallocating or underallocating resources to specific tasks. Additionally, you can use the Excel Gantt chart to adjust resource allocation and schedules in response to changes in project requirements, ensuring that you are always on top of project management.
What are some limitations of using Excel for project management?
Excel is a widely used tool for project management, but it does have some limitations. Some of the common limitations include:
Limited Collaboration: Excel is not designed for real-time collaboration among team members. If multiple people work on the same document, it can lead to version control issues and data inconsistencies.
Limited Scalability: Excel is not suitable for managing large-scale projects with multiple interdependent tasks. As the project grows, managing and updating data in Excel can become more time-consuming and challenging.
Lack of Automation: Excel requires manual data entry and updates, which can be prone to errors and can be time-consuming.
No Native Project Management Features: Excel is a general-purpose tool and does not come with built-in project management features like Gantt charts or task dependency tracking. These features need to be created manually or through add-ins.
Limited Data Analysis: While Excel provides basic data analysis features, it may not be sufficient for complex project analysis. For instance, you may need more advanced statistical analysis tools to analyze project data and identify potential issues or risks.
How can you improve collaboration among team members when using Excel for project management?
While Excel is not designed for real-time collaboration, there are some strategies to improve collaboration among team members when using Excel for project management. Here are a few tips:
Use Shared Workbooks: You can use Excel’s shared workbooks feature to allow multiple users to work on the same workbook simultaneously. This allows team members to collaborate in real-time and see changes made by others immediately.
Set Clear Guidelines: To avoid version control issues, you should set clear guidelines for how team members should update the workbook. For example, you can define how to format data, what to include in each column, and when to update the workbook.
Use Comments: Excel allows you to add comments to cells, which can be used to provide additional context or feedback on specific tasks or data.
Use Third-Party Add-Ins: There are several third-party add-ins available that can help improve collaboration in Excel, such as collaborative Gantt chart tools or real-time chat and commenting tools.
Provide Training: Providing training to team members on how to use Excel efficiently and collaborate effectively can help ensure that everyone is on the same page and using the tool correctly.
How can you integrate Excel with other project management tools?
Excel is a versatile tool that can be integrated with other project management tools to enhance productivity and efficiency. Integrating Excel with other project management tools allows you to leverage the unique features of both tools to manage projects more effectively. Here are a few ways to integrate Excel with other project management tools:
Importing and Exporting Data: Excel can be used to import and export data from other project management tools. For example, you can export data from a project management tool such as Primavera P6 and import it into Excel for further analysis and reporting.
Custom Reporting: Excel can be used to create custom reports from data extracted from other project management tools. You can use Excel’s advanced reporting features to create custom reports tailored to the specific needs of your project.
Data Visualization: Excel can be used to create visualizations such as charts and graphs from data extracted from other project management tools. These visualizations can provide a quick overview of the project status and highlight areas that require attention.
Macros: Excel macros can be used to automate repetitive tasks and streamline project management processes. For example, you can create a macro to update project schedules automatically based on changes in other project management tools.
Data Validation: Excel can be used to validate data imported from other project management tools to ensure accuracy and consistency. You can use Excel’s data validation feature to set rules that check the data for errors and inconsistencies.
Integrating Excel with other project management tools can help streamline project management processes and improve collaboration among team members. With the right integration strategy, Excel can become an essential tool for managing projects effectively.
What are some common mistakes to avoid when creating a Gantt chart in Excel?
When creating a Gantt chart in Excel, there are several common mistakes that should be avoided. One of the most common mistakes is not properly labeling the chart elements, such as the task names, start and end dates, and dependencies. Another mistake is not updating the Gantt chart regularly to reflect changes in the project schedule. This can result in an inaccurate representation of the project timeline and can cause confusion among team members. Additionally, it is important to ensure that the Gantt chart is easy to read and understand. This can be achieved by using clear and concise labeling, avoiding clutter and unnecessary information, and using consistent formatting throughout the chart. Lastly, it is important to avoid using too many colors or overly complex formatting, as this can make the chart difficult to read and understand. By following these best practices and avoiding common mistakes, you can create a clear and accurate Gantt chart in Excel that helps to keep your project on track.
How can you ensure that the Excel Gantt chart is easy to read and understand?
To ensure that the Excel Gantt chart is easy to read and understand, you can follow these best practices:
Use clear and concise activity names: Use activity names that accurately describe the tasks and are easy to understand.
Include start and finish dates for each activity: This information helps in understanding the sequence of tasks and the duration of the project.
Color code the chart: Color coding can be used to visually distinguish between different tasks, teams, or milestones. For example, critical tasks can be highlighted in red.
Use conditional formatting: Conditional formatting can be used to highlight tasks that are overdue, on track, or completed.
Use descriptive axis labels: Ensure that the axis labels are descriptive and easy to understand.
Limit the number of activities per line: To avoid clutter, limit the number of activities displayed per line.
Use vertical gridlines: Vertical gridlines can be used to make it easier to read the chart and understand the sequence of tasks.
Ensure the font size is legible: Use a font size that is easy to read and not too small.
How can you track progress and make updates to the Excel Gantt chart?
Tracking progress and making updates to an Excel Gantt chart is essential to keeping a project on track and ensuring it meets its goals. There are several ways to do this, including updating task progress, adding new tasks, and adjusting the timeline. Here are three common methods for tracking progress and making updates to an Excel Gantt chart:
Updating Task Progress: One way to track progress is to update the completion percentage of each task. To do this, simply select the task you want to update, click on the “Percentage Complete” column, and enter the percentage complete. You can also use conditional formatting to color-code the progress bars in the Gantt chart based on the percentage complete.
Adding New Tasks: If you need to add new tasks to the project, you can do this by inserting new rows into the Excel Gantt chart. Simply right-click on the row number where you want to insert the new task, select “Insert,” and choose “Entire Row.” Then, fill in the task details, such as the task name, start date, and duration.
Adjusting the Timeline: Finally, you may need to adjust the timeline of the Excel Gantt chart to reflect changes in the project schedule. To do this, simply select the timeline and drag it to the left or right to adjust the start or end date. You can also adjust the scale of the timeline by clicking on the “Format” tab and choosing the desired time unit (e.g., days, weeks, months).

